
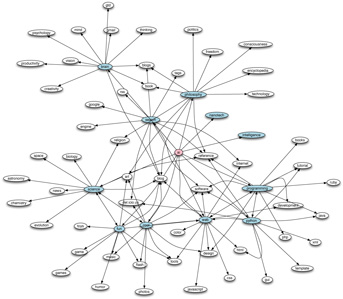
Several people have asked me how I produced the visualizations that I used in my talk on del.icio.us. While those visualizations were constructed with a rather eclectic mixture of homebrewed code, assorted applications, and a good bit of elbow grease, I decided to put together a tutorial for people who might be interested in this type of visual exploration, but are not inclined to write custom Perl code to do so. Hence, I have selected a combination of two very nice applications for Mac OS X - Anthracite and OmniGraffle - to produce similar visualizations. Neither application is free, but both have free trial periods, should you be inclined to check them out. As an alternative to OmniGraffle, the excellent open source program Graphviz may be used, although it is less user-friendly than OmniGraffle. Finally, since the files that will be produced by Anthracite are in a simple text-based format (known as the dot format), a good text editor might come in handy for those people who want to modify these files by hand - TextWrangler is an excellent and powerful text editor, and is available for free.
The sequence of steps we will go through is as follows:
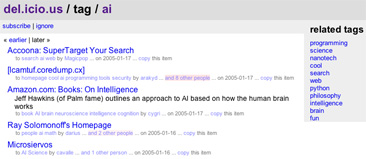
- run Anthracite to obtain the list of tags from the del.icio.us website that we wish to graph;
- run Anthracite a second time to create a dot file that contains the necessary information to create the graph;
- run OmniGraffle to create the actual graph.
In the discussion that follows, I will assume that you have gone through the basic Anthracite tutorials, and the basic OmniGraffle tutorials. While you don't need to be a pro with either program to follow the steps outlined, you do need to know your way around both of them. Finally, for those people who just want to run the software and forget about the tutorial aspect for now, make sure to change the following objects in the Anthracite files:
- In the preprocessor: retrievetags, taglist
- In the processor: readtaglist, dotfile
Instructions for doing this are found on the following pages. You will also need to rename one of the files (dotfile.txt), as described in part 3 before using it in OmniGraffle. It is important to note that the preprocessor and processor programs overwrite their output files every time they are run, since they are intended as "scratch files" - if you wish to keep them, you should rename them or move them to a different directory.
The Anthracite files can be downloaded (in compressed ZIP format) at:
Preface: the dot file format
The dot file format was created at AT&T Bell Labs, for the express purpose of representing graphs. The full format is documented on the Graphviz site. For our purposes, though, we will only be using a subset that can be described as follows:
digraph delicious {
node1 [style=filled, color=lightblue];
node2 [style=filled, color=pink];
...
node1 -> {node3 node4 node17};
node2 -> {node1 node3 node6};
node3 -> (node2 node6};
...
}
The first line tells the program reading the file that the graph is of the digraph type, i.e., a graph in which nodes (the tags from del.icio.us in our scenario) are connected by directed edges (lines with arrows on them), and is titled delicious. The next two lines tell the program how nodes 1, 2, etc. should be drawn, and in what color. node1, node2, etc are the labels that will identify nodes in our final diagram. The three lines following those tell the program what nodes to connect with arrows. Thus, the first line of this type states "draw an arrow from node1 to node3, another arrow from node1 to node4, and a third arrow from node1 to node17". While the dot file format has many more options, this subset will suffice for our goals - for those people interested in some of these options, multiple documents are available on the Graphviz site.
Next: Part 1 - Writing the Preprocessor